
Image-Charts has taken $544,079 by replacing an API Google switched off
A French founder built a copy of Google Image Charts that kept the same URL format. Nine years later it still earns $6,270 a month from 50 customers, though that number is slowly falling.
Product at a glance
Summary
What this business is
Image-Charts turns a web address into a chart image that can go into an email, a PDF or a chat message, where interactive charts cannot run. François-Guillaume Ribreau, a French developer, started it in 2017 as a replacement for Google Image Charts, which Google had deprecated in 2012 and switched off on March 14, 2019. Image-Charts kept Google’s URL format, so old links could move with a change of domain. It has taken $544,079 in verified revenue. Today it earns $6,270 a month from 50 subscriptions, down from 62 a year ago.
Why these scores? See the reasons in Key takeaways →
Momentum
Declining. Revenue: last three complete months −52% on the three before; −73% on the same months half a year earlier.Derived
Best suited for
Builder (main). A compatible API, fast rendering and long-term upkeep.
Operator (second). Keeping a shrinking product profitable is maintenance, not growth.
What you need to start. An eye for APIs that big companies are about to retire, and a product ready before the switch-off.Our read
Key findings
Product overview
One URL, one chart image, anywhere an image can go.
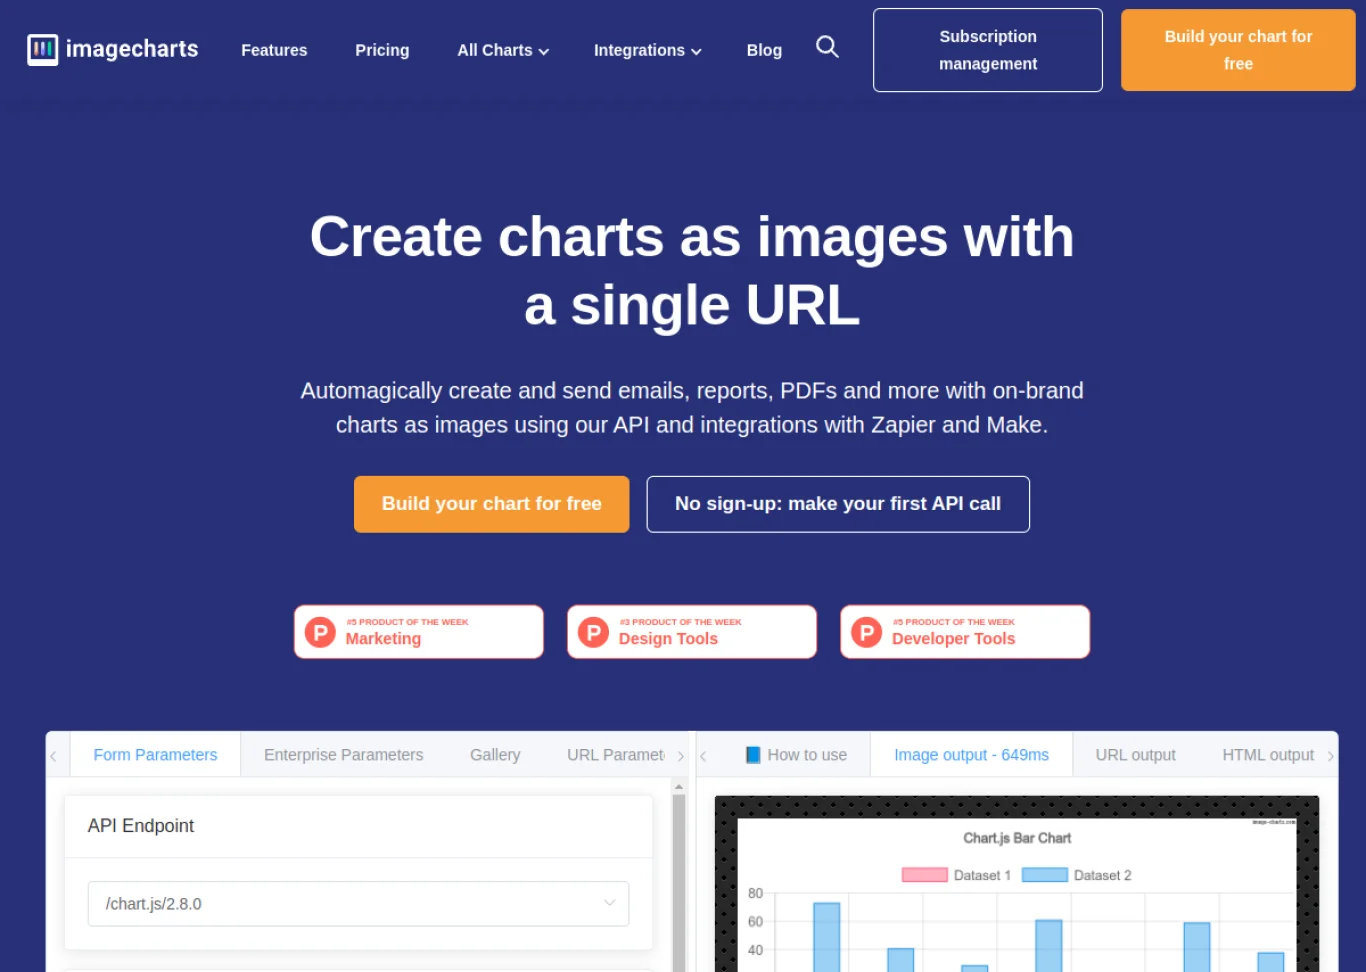
A chart is described in the URL itself: type, data, colours and labels. Requesting the URL returns a PNG or an animated GIF[2]. That works in email, PDFs and chat apps, where JavaScript charting libraries cannot run. Around the API sit a chart editor, code examples in six languages, and Zapier and Make integrations for no-code users[2].
The homepage shows logos of large companies and calls Image-Charts the most used static chart API, without a figure[2]. TrustMRR shows 50 paying subscriptions[1].
What the site looks like
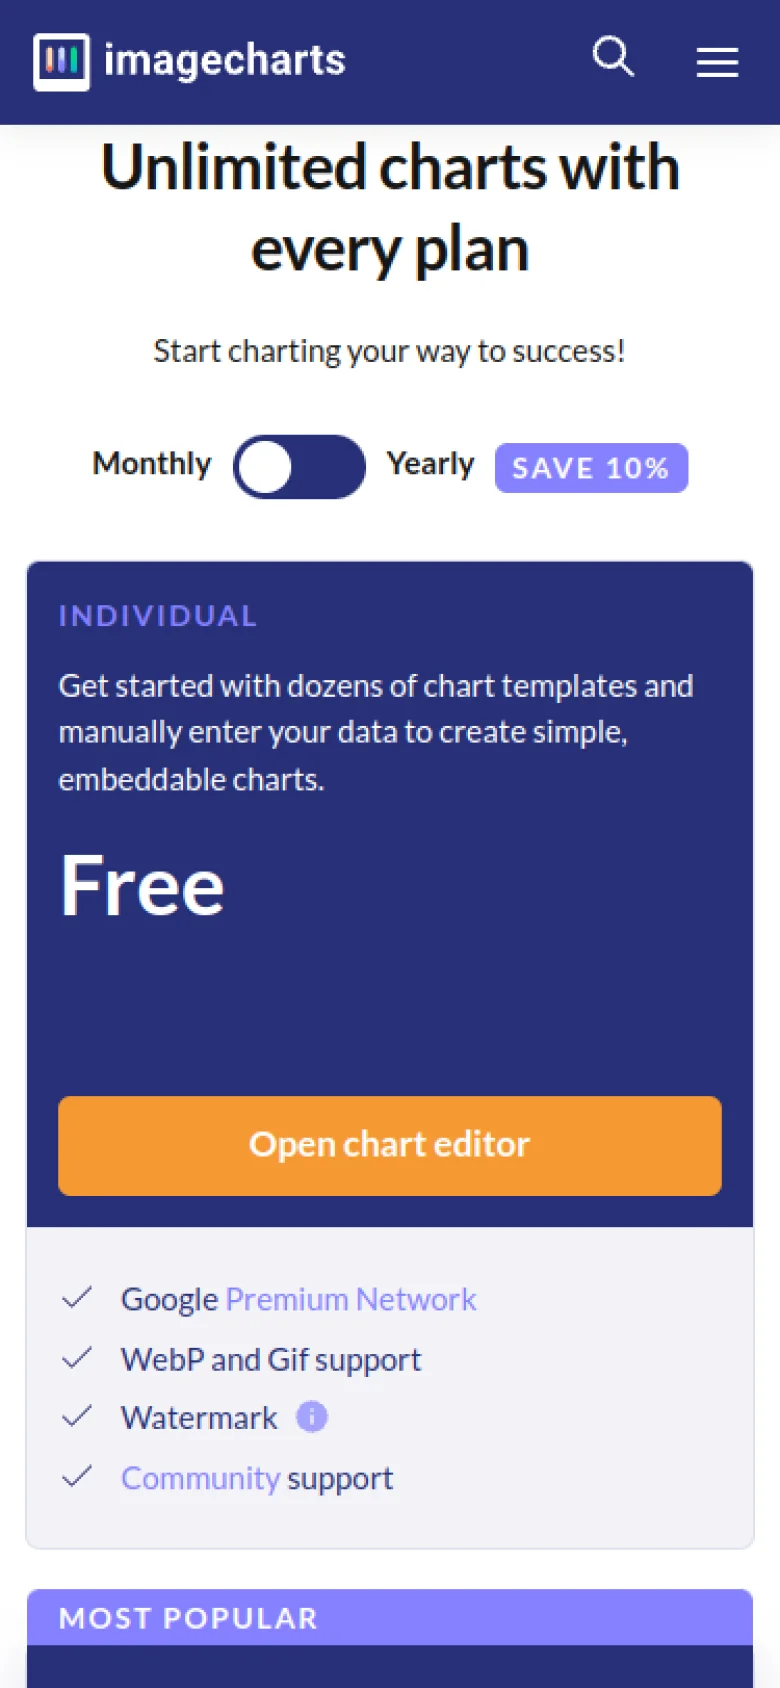
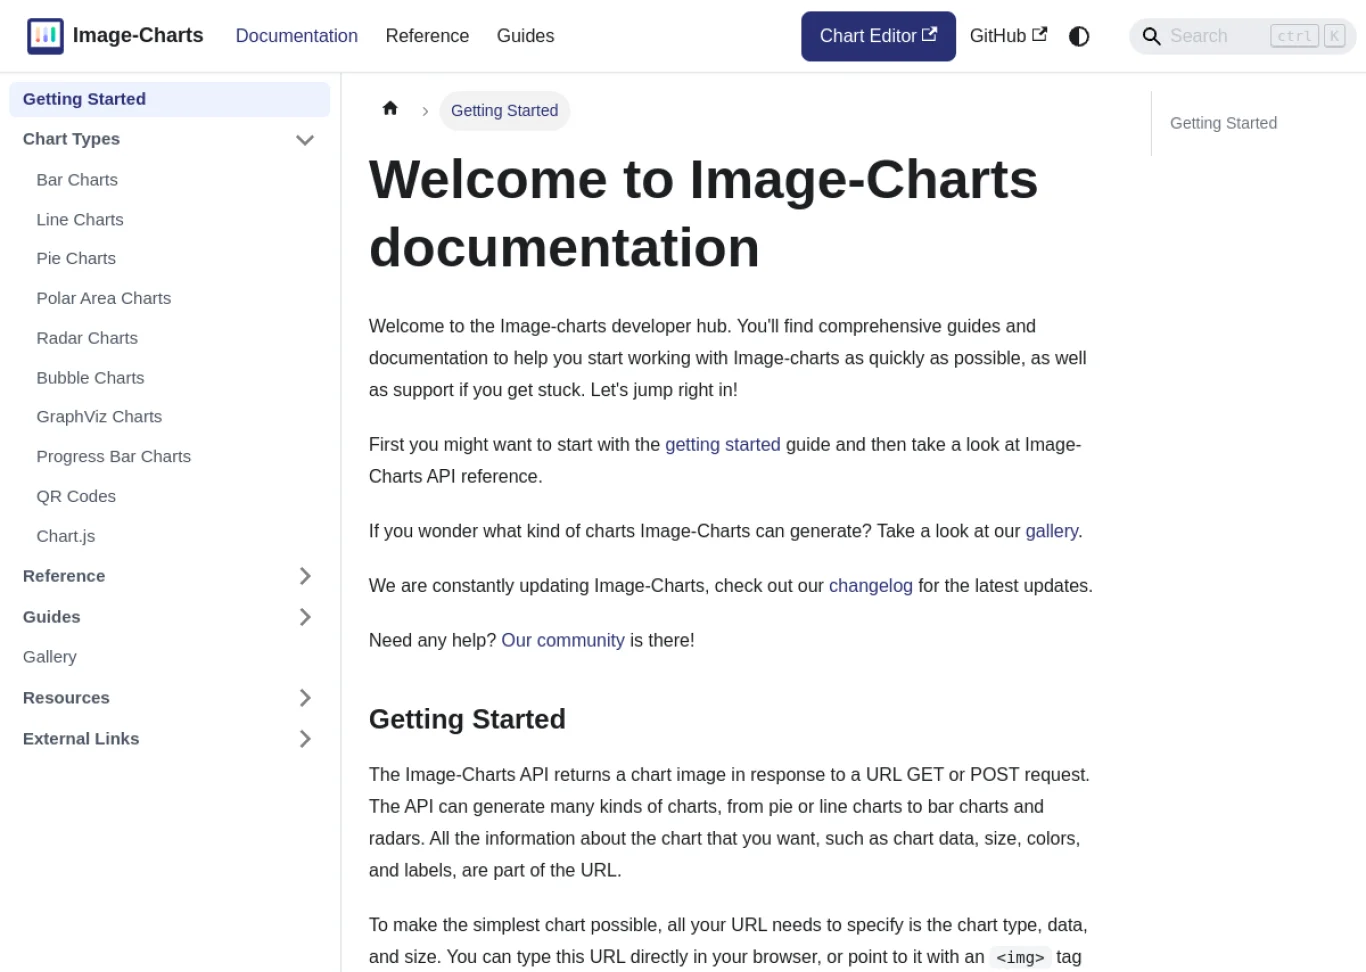
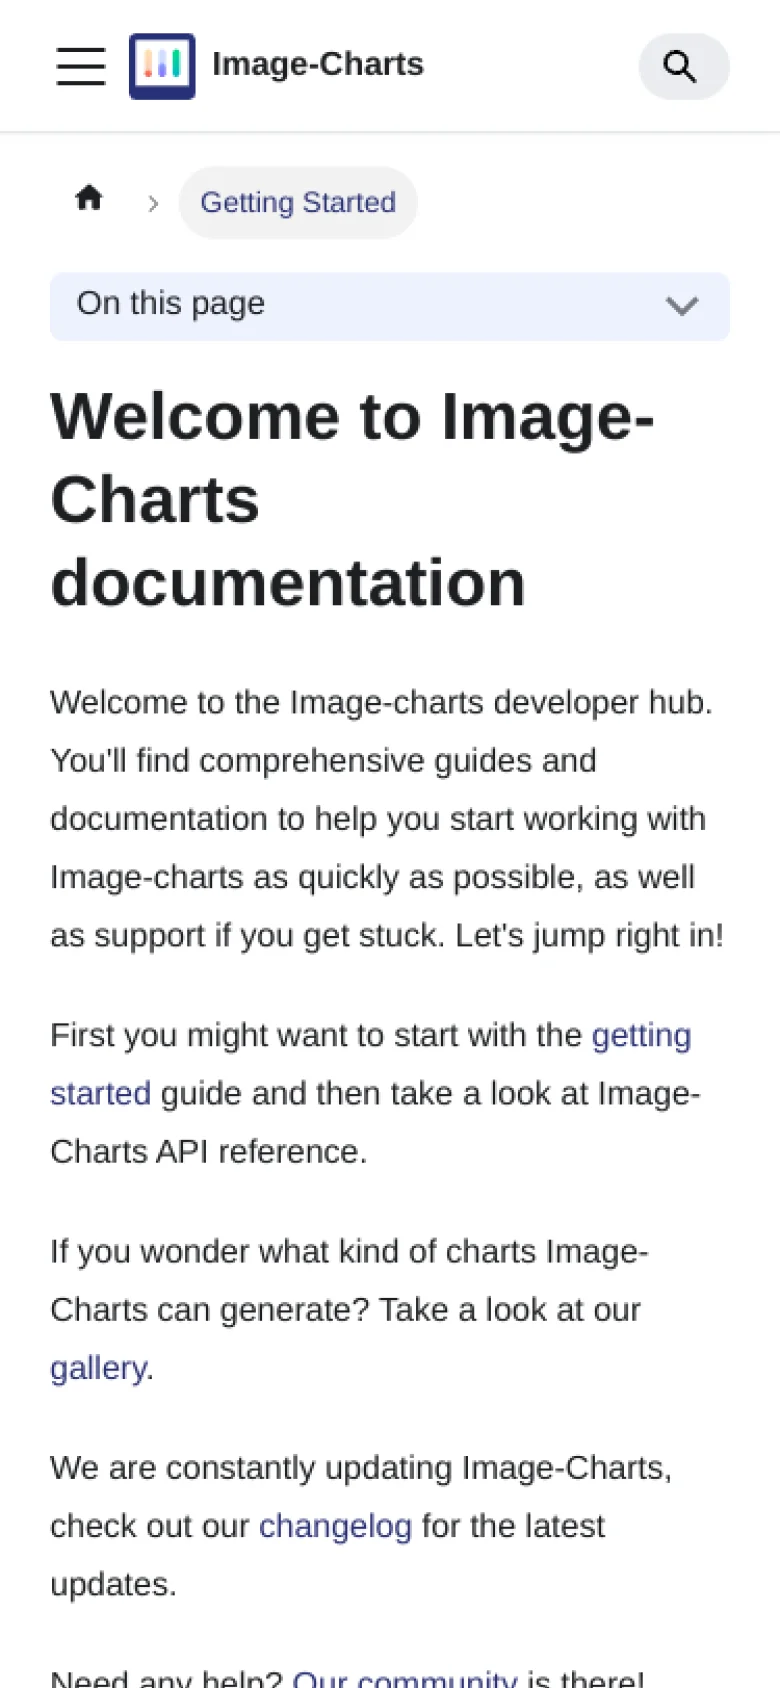
Captured Nov 11, 2026 · Screenshots: image-charts.com.
What to look for
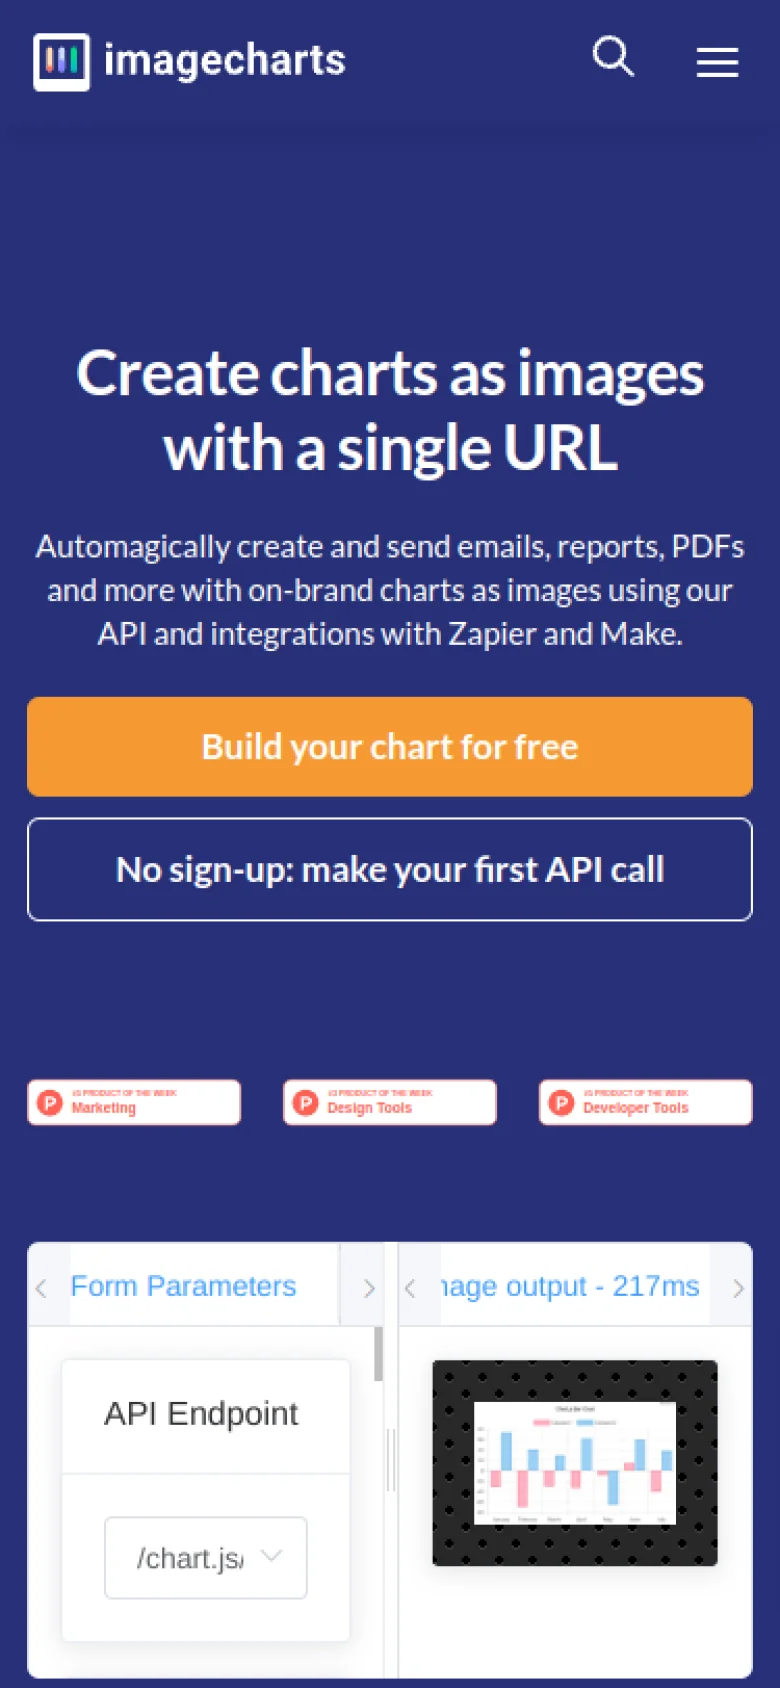
- 1“Create charts as images with a single URL”: the whole product in one line.Fact
- 2Two buttons: a chart editor and “make your first API call” with no sign-up.Fact
- 3Logos of large companies and the claim of being the most used static chart API, with no figure given.Fact
What to look for
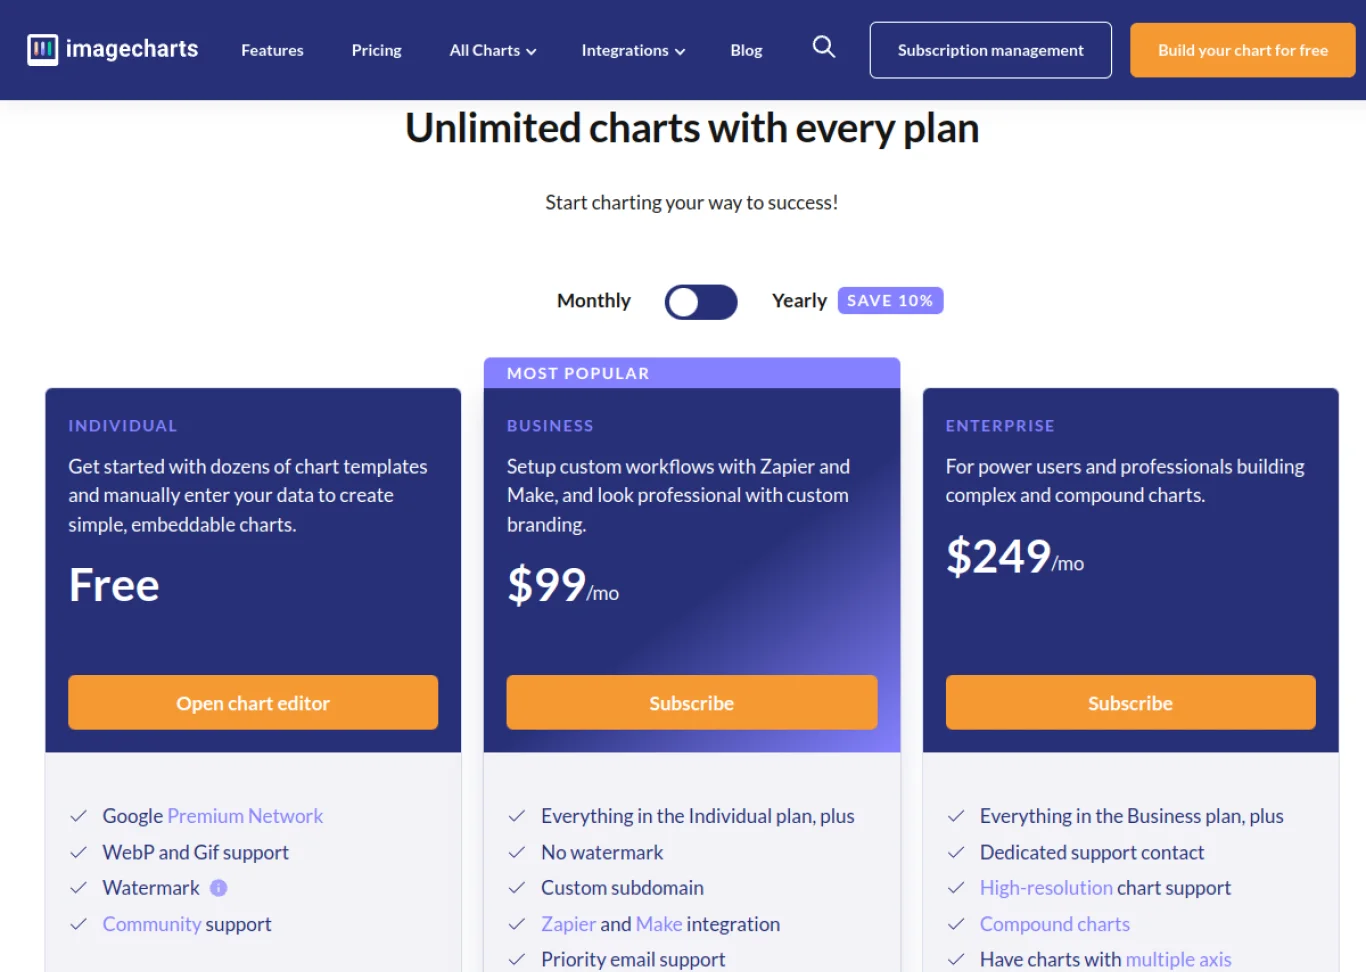
- 1Three plans: Free, $99 and $249 a month, shown here on monthly billing. See §03.Fact
- 2Free charts carry a watermark; paying removes it.Fact
- 3Yearly billing takes 10% off: $89 and $224 a month.Fact
What to look for
- 1The docs are the product’s front door for developers.Fact
- 2Chart types are listed by name in the side menu.Fact
- 3A changelog and a community link show it is still maintained.Fact
| Plan | Monthly | Yearly billing | Note |
|---|---|---|---|
| Free | $0 | $0 | Charts carry a watermark |
| Business | $99 | $89/mo | Most customers, judging by MRR per subscription |
| Enterprise | $249 | $224/mo | For complex and compound charts |
From the live pricing page[2] and an archived copy from Aug 28, 2026[4].
Revenue analysis
Three big months a year, quiet ones in between, and a slow decline underneath.
Hover or tap a bar. Monthly verified revenue from TrustMRR[1], December 2025 to November 2026. November covers Nov 1–11.
Our arithmetic on the verified data in this report. Revenue ÷ MRR uses the last 30 days; the share of all-time revenue counts the months in the chart above; the swing is the median change between complete months.
January ($18,673), April ($17,007) and July ($9,141) brought $44,821, or 63% of the eleven full months[1]. The other eight months ranged from $2,311 to $6,626[1]. Revenue over the last 12 months was $78,621, close to MRR × 12 = $75,240, which fits yearly plans renewing in clusters.Derived
| Date | MRR | Active subscriptions | MRR per subscription |
|---|---|---|---|
| Dec 4, 2025 | $7,981 | 62 | $128.73 |
| Nov 11, 2026 | $6,270 | 50 | $125.40 |
December 2025 from an archived copy of the TrustMRR page[3], where MRR was marked as an estimate; November 2026 from the live page[1]. The last column is our division.
Daily revenue
Hover or tap a bar. Verified daily revenue, Oct 13 – Nov 9, 2026 (UTC), from TrustMRR[1], rounded to whole dollars. Blue: Saturdays and Sundays. Twelve of the 28 days had no revenue.
62 to 50 in eleven months.Derived
$7,981 to $6,270.Derived
86% was earned earlier.Derived
Total revenue on both dates.Derived
Market
QuickChart launched as a free, open-source replacement when Google announced the switch-off[5][6]. Google itself pointed users to its JavaScript chart library[5]. We found no rival with verified revenue on the same basis, so revenue is not compared.
Pricing: two paid plans and a watermark
The free plan does the marketing; the watermark does the selling.
Free charts carry a small watermark. Removing it, along with higher limits and branding options, costs $99 a month, or $89 a month on yearly billing[2][4]. The team described the same model in 2019: free with a watermark, paid to remove it[5].
$89 × 12.Derived
$224 × 12.Derived
Between the two plans, closer to Business.Derived
Where customers come from
From people looking for a way out of Google’s shutdown.
In March 2019 the team replied in Google’s announcement thread, offering Image-Charts as a drop-in replacement.[5]
FactOld Google chart links work after a domain change, so existing users had a reason to try it first.[5]
Our readThe competitor
In the same Google thread, QuickChart’s founder announced a free, open-source replacement with no watermark[5]. Free and open source is hard to beat on price; Image-Charts sells on compatibility, reliability and support instead.Our read
What we could not read
TrustMRR has no traffic data for Image-Charts. Sign-ups by channel are not public.
Growth strategies
Three moves, each visible from outside.
Timeline
- Jan 22017ProductFounding date on TrustMRR.[1]
- Feb 92019BackgroundGoogle says Image Charts will be turned off on Mar 14, 2019.[5]
- Mar 52019MarketingThe team offers Image-Charts as a replacement in Google’s thread.[5]
- Dec 42025RevenueTotal revenue $472,308; MRR about $7,981 from 62 subscriptions.[3]
- Jan2026Revenue$18,673, the biggest month of the last twelve.[1]
- Nov 112026RevenueMRR $6,270 from 50 subscriptions; $544,079 all-time.[1]
Key takeaways
Image-Charts shows that a big company’s shutdown can pay a solo founder for years, if the replacement is ready first and changes nothing for the user. It also shows the limit: a replacement market slowly runs out of people to replace.
Why we scored it this way
Copy
- Build the replacement before the switch-off. Image-Charts was running years before Google turned the old API off. P1
- Keep the old format. Same URL parameters, so moving takes minutes. P1
- Answer in the shutdown thread. The team offered its replacement in Google’s own announcement thread. P2
- Sell yearly to a small number of businesses. 50 customers at about $125 a month is enough to keep it running. P3
Avoid
- Expecting a replacement market to grow. The old users only leave over time. §02
- Leaving the free option to someone else. QuickChart took the free, open-source spot. §04
- Reading one month’s revenue as the trend. Yearly renewals make single months misleading. §02
Our predictions
Three claims with dates. We mark each one right or wrong on its date and keep the result on the page.
Track record: the predictions in our earlier reports are still open; the first checks land Dec 1, 2026. We mark each prediction right or wrong on its date and keep the result on the page.
What could prove us wrong
Things that would change our read, and how to check them.
- The yearly-renewal reading is our inference. The lumps fit yearly billing, but TrustMRR does not show billing periods.Check: January 2027 revenue.
- Most of the history is out of view. 86% of all revenue came before the last twelve months, and we cannot see when.Check: not public.
- New uses could revive demand. Charts in AI chat bots and automated reports are a fit the product already pitches.Check: subscriptions on the next review.
- The founder runs other products. How much time Image-Charts gets is not public.Check: the changelog.
Appendix
FAQ
How much does Image-Charts make?
MRR is $6,270 from 50 subscriptions as of Nov 11, 2026, verified through Stripe on TrustMRR. It earned $78,621 in the last 12 months and $544,079 in total.
What does Image-Charts cost?
There is a free plan with a watermark. Business is $99 a month or $89 a month billed yearly; Enterprise is $249 a month or $224 a month billed yearly.
Is Image-Charts a replacement for Google Image Charts?
Yes. Google switched off Image Charts on Mar 14, 2019. Image-Charts uses a compatible URL format, so most old chart links work after changing the domain.
Who runs Image-Charts?
François-Guillaume Ribreau, a French developer, founded it in January 2017. It has no outside funding.
Sources
- [1]TrustMRR: Image-Charts — revenue, MRR, subscriptions, daily and monthly data. Verified through a Stripe API key. Synced 2026-11-11 02:14 UTC.
- [2]
- [3]Wayback Machine captures of the TrustMRR page for Image-Charts on Dec 4, 2025 and Mar 15, 2026 — MRR, subscriptions and total revenue on those dates. Read 2026-11-11.
- [4]Wayback Machine capture of image-charts.com/pricing on Aug 28, 2026 — plans and prices. Read 2026-11-11.
- [5]Google Chart API group: Important: Google Image Charts will be turned off soon, Feb–Mar 2019 — the shutdown date, the 2012 deprecation, and replies offering replacements. Read 2026-11-11.
- [6]QuickChart: How to replace Google Image Charts with Open Source — the free, open-source competitor. Read 2026-11-11.
Screenshots © Image-Charts, used for commentary. Oddig has no business relationship with Image-Charts. Numbers change daily; check the sources for the latest.



Comments are closed for this article.