

Oddig editorial note: The source episode is dated July 23 in the US and July 24 in China. The founder's finance figures are self-reported and refer to different periods. This is business-model analysis, not investment or trading advice. Create the original cover before publication.
“Five hours a week” is the headline. The machinery behind it is much more instructive. In a Starter Story interview, Timo Köhler says he and his brother built ChartDetector AI, a mobile app that interprets photos of stock or crypto charts. He reports roughly $56,000 in monthly revenue at the time of interview, 13,000–14,000 downloads a month, and about 20 hours of his own operating time per month. In a separate example from April, he reports $43,700 in revenue, about $20,000 of ad spend, roughly 15% Apple fees, and approximately $11,500 profit.
Those two revenue figures should not be blended into one month. Neither should the founder's hours be treated as total labor hours: the interview discusses a two-brother team, ad creative, tracking configuration, platform infrastructure, and earlier work that produced the system. The valuable case is how a subscription business buys attention, measures paid activation, and decides whether a dollar spent on TikTok returns more than a dollar of contribution. It is not proof that software becomes effortless after launch.
Watch 01:30–02:49 for the product and claimed figures, 05:50–06:37 for the April cost breakdown, and 06:37–10:56 for the ad funnel. The founder is describing his own experience, not an independently audited portfolio of campaigns.
Start with the product, not the ad account
n
n
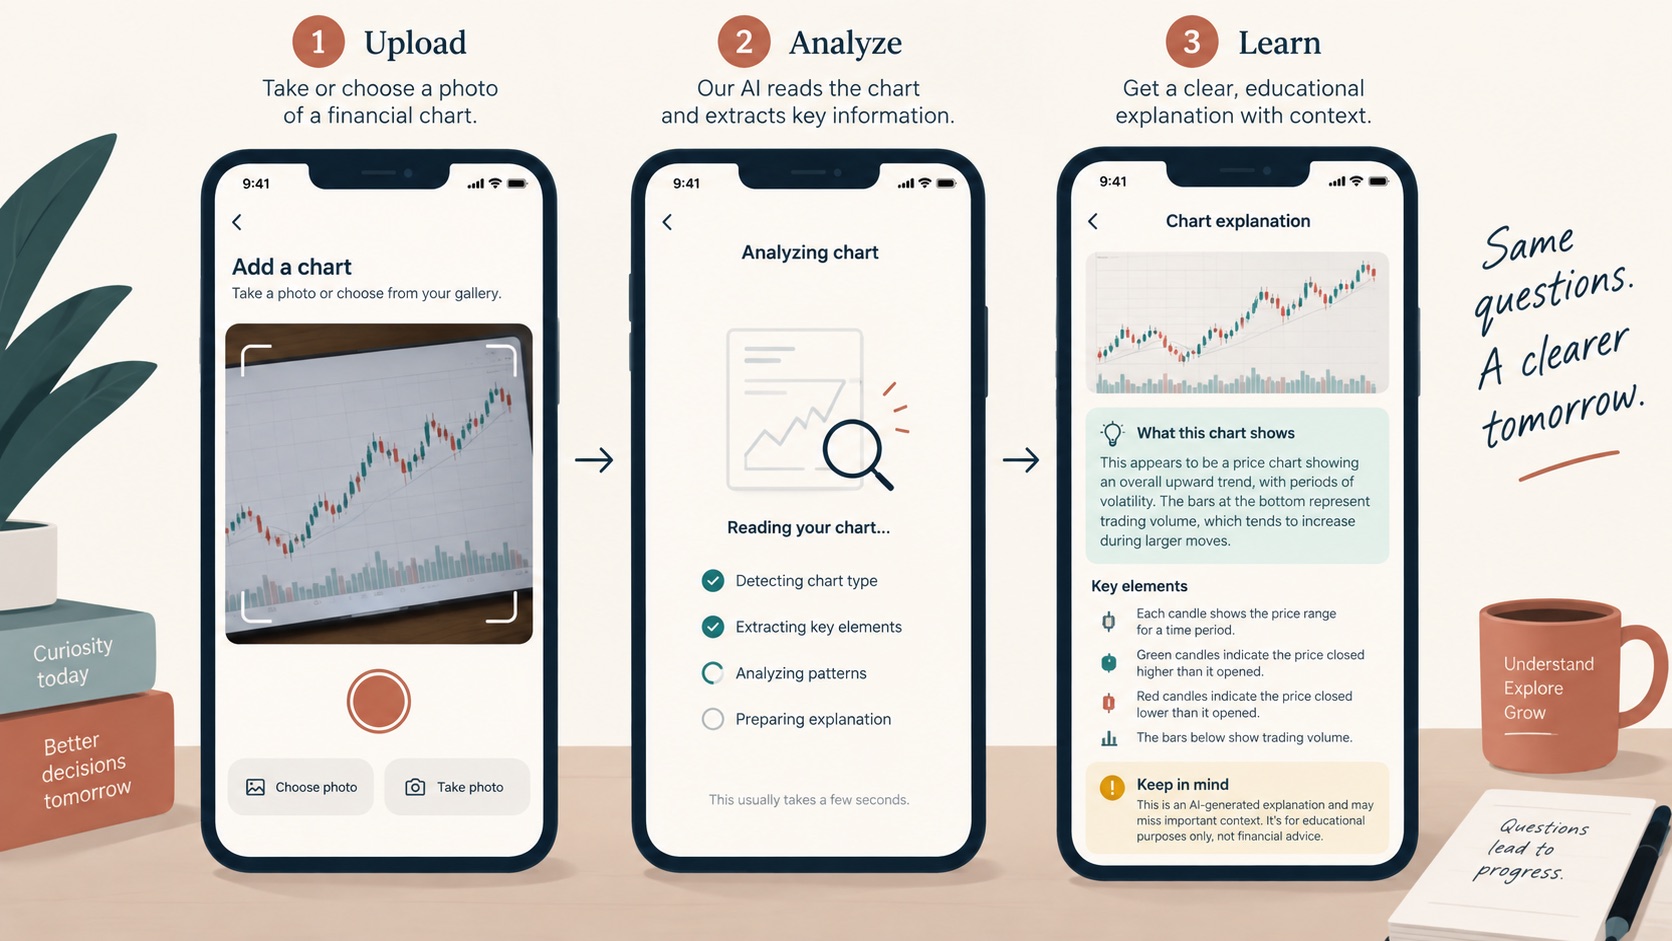
The product grew out of a Telegram bot that used AI image input to analyze a chart. Timo says the team turned it into a mobile application after seeing that the visual interaction could be packaged for a wider audience. The product website confirms that its public pitch is AI analysis of uploaded trading charts. The paid app offers a short route from screenshot to interpretation. That route explains why a demonstration video might sell: it shows a recognizable input and a visible output in seconds.
There is a serious limitation. A chart interpretation is not a reliable prediction of future prices, and a fluent AI answer can make uncertain information look confident. The product site and interview establish the existence and positioning of the app, not the accuracy of its trading suggestions. We have not reviewed audited outcomes from users' trades, nor could an ad campaign ethically imply that profits are guaranteed. A founder studying this case should copy the clarity of the demonstration, not a claim of trading efficacy.
The app reportedly uses a hard paywall—no free trial—and offers a $12.99 weekly plan and a $59.99 six-month plan in the interview. The six-month plan lowers the apparent weekly equivalent but asks for a larger upfront commitment. Both prices are interview-era figures, not a promise of today's store prices. They matter because immediate payment gives the ad system a fast signal and shortens cash payback. They also create risk: a hard paywall may reduce the number of people who experience enough product value to stay, while a weekly subscription can lead to refunds or churn if expectations are wrong. Without cohort retention and refunds, we cannot call the pricing optimal.
| Founder-reported metric | Period or meaning | Missing context |
|---|---|---|
| More than $56,000 monthly revenue | At interview time | Store proceeds, refunds, recurring vs new sales |
| 13,000–14,000 downloads | Monthly | Paid vs organic split and qualified installs |
| Approximately $260,000 total revenue | First roughly 13 months | Acquisition cost and recognized revenue |
| $43,700 revenue, ~$20,000 media, ~$11,500 profit | An April example | Full reconciliation, taxes, labor, and cash timing |
| ~20 hours of founder time | His current monthly operating time | Brother's work and outsourced work |
The April arithmetic is a useful caution. Fifteen percent of $43,700 is about $6,555. Subtracting that and $20,000 of ads leaves roughly $17,145 before AI costs, tools, refunds, overhead, taxes, and any other expenses. A claimed $11,500 profit implies another roughly $5,645 in costs or adjustments. That rough residual is our calculation from rounded statements, not a line item reported by the founder. It shows why “revenue minus ads” is not profit. If the platform fee applies to a different base, the exact residual changes.
What demand is the app capturing?
ChartDetector sells speed and interpretation to people already looking at trading charts. This is a distinct job from a general-purpose chatbot. The user can take a screenshot of the artifact in front of them, upload it, and receive an explanation without learning a prompt format. The category had obvious visibility when multimodal AI became easier to access, and Timo says that new image-input capability helped inspire the first bot. Whether customers continue paying depends on repeated utility and trust, not on novelty alone.
The distribution fit is unusually visual. A creator can record the screen, show the screenshot, and reveal the result in a few seconds. Timo says one ad showing the app in use generated nearly five million views and more than $15,000 of revenue. This is founder-reported attribution. The interview does not give that ad's spend, incrementality, or retention of users it acquired. Five million views could be a successful creative test, but views are not a unit-economic metric. A better question is how many paying, retained users the creative brought at what net cost.
The customer need also has a trust problem. Financial markets are noisy. A chart can be explained in many ways and a model may hallucinate. The product must make the distinction between description, scenario, and forecast clear. A business that grows through aggressive outcome claims may acquire users quickly and lose them quickly. The interview does not provide complaint or refund data, so this remains a risk to inspect, not a demonstrated failure.
Reverse-engineering the acquisition system
Timo's description has four operational steps: prepare an onboarding flow that shows the outcome, send paid-conversion events back to the ad platform through a mobile measurement partner, test several short videos, and increase spend only when the economics hold. He says the team uses TikTok ads, AppsFlyer for mobile attribution, RevenueCat for subscriptions, and a React Native/Expo app with Supabase. The tools are less important than the causal chain they support: ad impression → install → onboarding → paywall → payment → retention or refund.
He recommends starting with at least six videos and optimizing toward subscriptions rather than installs. This distinction is critical. A campaign optimized for cheap installs can find users who never pay. An event that records a paid subscription gives the algorithm a closer approximation to the business goal. Yet that event must be implemented accurately. If subscriptions are misattributed or duplicated, the campaign can appear profitable when it is not. Timo specifically warns that tracking setup can be complex and suggests specialist help. Builders should keep a manual reconciliation of store payments, attribution data, and spend even when using an MMP.
He describes broad targeting, often specifying only country, and says some non-US markets performed better for him. This is not evidence that any specific country is underpriced for every app. Price, consumer spending, payment methods, language, ad inventory, and regulatory context all matter. His $50-per-day starting budget and his guidance to avoid changing campaigns during an initial learning period are examples of his setup, not universal platform rules. TikTok's products and algorithms can change. Test with a capped amount you can afford to lose.
His weekly operating loop is simple but not passive: inspect return on ad spend, increase budget when results remain profitable, produce new creative when performance weakens, and watch for creative fatigue. He says the team avoids increasing a budget too quickly and mentioned a 20% change every three days as a working rule. Again, the current platform may behave differently. The reproducible principle is controlled experiments and fresh creative, not the exact percentage.
Contribution margin is the decision metric
Timo gives an example: if it costs $1.50 to acquire a download and the average user yields $3, the apparent ratio is 2:1. That example is not a complete ROAS calculation unless the $3 is revenue attributable to the same campaign and time horizon. Nor does it account for fees or marginal costs. A robust calculation separates:
- Cost per qualified install: media spend divided by people who reach a meaningful in-app step, not only raw downloads.
- Paid conversion: the share of those people who pay after onboarding and the paywall.
- Net revenue per paid user: payments after platform fees, discounts, refunds, and taxes where appropriate.
- Gross margin per user: net revenue minus AI inference, support, and other variable delivery costs.
- Payback time: how long it takes the user contribution to cover acquisition cost.
For example, a $2 install that converts 5% to paying customers means $40 media cost per initial customer before attribution errors. If each paid customer contributes $30 after fees and variable costs over the measured horizon, the campaign is losing money even though installs are cheap. If the average customer contributes $70 and refunds are low, the same campaign may work. These are illustrative numbers, not ChartDetector results. They show why the whole funnel must be measured.
The hidden work in a “five-hour week”
The interview frames 20 hours a month as the founder's current workload. It does not say that two brothers collectively work only 20 hours, that video production requires no labor, or that the system required only 20 hours to build. There is setup work in app development, creative testing, payment configuration, API costs, analytics, and support. There is also ongoing risk when ad performance changes. If one effective video fatigues or an ad account is suspended, the operator must replace the acquisition flow. Automated campaign allocation reduces manual bidding; it does not automate product trust, customer service, or creative ideation.
The founder reports about 40 million total impressions and 7–8 million views in the prior 30 days. Those figures help explain the volume of attention but not its conversion quality. A 25% profit margin in one month, as he reports, leaves some room for operating costs; it is not a wide margin if refunds rise or advertising prices increase. And because the category touches financial decisions, the product must be careful about claims. “AI analyzes a chart” is one thing; “AI tells you what will happen to a stock” is a much stronger and potentially misleading proposition.
A safer test for a mobile subscription founder
First, select a user task that can be demonstrated in one short screen recording. Prove the task works for real users before buying large volumes of traffic. Ask five to ten target customers to complete it unaided, then fix where they get stuck. Write down exactly what the app says it can and cannot do. For a financial-information tool, seek appropriate review of claims before advertising. The goal is a useful interpretation workflow, not a claim of investment returns.
Second, instrument the complete payment path. Record an anonymous install identifier, onboarding completion, paywall impression, payment, renewal, refund, and cancellation. Reconcile daily payment events with store records. Do not count a trial, click, or paywall impression as revenue. Measure customer value by acquisition cohort and country; the same ad may be profitable in one market and not another.
Third, create a small set of distinct videos, not six versions of one hook. Demonstrate the same customer job through different contexts, such as confusion over a chart annotation, a quick explanation of a pattern, and a screenshot-to-summary workflow. Disclose uncertainty and avoid implying guaranteed trades. Start with a limited test budget and predefine a stop loss. Compare creative-level paid conversion and refunds, not views alone.
Fourth, scale in increments only when a cohort has enough time to reveal its value. A weekly subscription may show payment quickly, but churn can erase the value after the first week. A six-month plan brings cash upfront yet may conceal satisfaction problems until the next renewal. Keep a creative replacement queue and a contingency plan for tracking outages. If profitability depends on one ad, one country, or one opaque attribution setting, the system is fragile.
Finally, decide whether paid media is actually the right channel. Ads are attractive when the offer is immediately legible, conversion is measurable, and customer value exceeds acquisition cost. If the product needs trust-building or a long explanation, content, partnerships, or a professional audience may be better. Timo's channel fit should be tested, not assumed.
Editorial verdict
ChartDetector's interview makes a useful point behind an attention-grabbing income claim: a founder can trade time spent creating organic posts for money spent on controlled acquisition, but the trade is neither free nor riskless. The product has a clear visual demonstration and a fast payment event; those features make TikTok testing plausible. The founder's April example suggests a profitable month, while still showing significant ad spend and platform fees. We cannot independently verify the full financial statements, trading efficacy, or the durability of the current monthly figure.
Before imitating the model, build a spreadsheet that survives realistic churn, refunds, and rising CPMs. Then test whether your app has the same properties: a customer problem visible in seconds, honest claims, a measurable purchase event, and contribution margin left after acquisition. The lesson is not “buy ads and work five hours.” It is “make the economics visible enough that you know when to buy the next customer.”
Operator checklist
- Define the customer job and claims the app can substantiate.
- Instrument purchase, renewal, refund, and cancellation, not only installs.
- Calculate paid CAC and contribution margin by cohort and country.
- Reconcile attribution reports against actual store proceeds.
- Test varied, original creative with a capped loss budget.
- Keep updating creative and monitor fatigue, churn, and policy risk.
- Report founder hours and all team/contractor labor separately.
Sources & further reading
- Starter Story interview with Timo, published July 23, 2026 — primary transcript for the founder's revenue, cost, time, pricing, product, and acquisition claims.
- Original Starter Story video — demonstrations and interview context.
- ChartDetector AI product site — primary source for current public positioning, not independent evidence of finance or prediction accuracy.