

1Lookup: $547,960 in 30 days — how much of that demand will repeat?
1Lookup sells credit-based data lookups, with $547,960 in payment-verified revenue over the last 30 days and $255,025 in current MRR. October was a record complete month, but the latest three complete months were roughly flat. Repeat customer usage and supplier costs matter more than the headline gap.
Product at a glance
Summary
Can 1Lookup repeat its recent usage revenue without sacrificing data-delivery economics?
1Lookup bundles phone, email, IP and other data lookups into one credit balance. The public record establishes substantial receipts, not the repeatability or profitability of each workload. For a builder, the useful design choice is metered expansion across a shared balance. For a buyer, the unresolved issue is how much usage and data access would survive a transfer.
Why these scores? See the reasons in Decision summary →
Momentum
Steady. August–October revenue was 0.6% below May–July. The Steady label describes those complete-month totals; October’s record does not establish continued acceleration.[1]Derived
Best suited for
Builders of usage-priced APIs (main). Study metering and expansion alongside the cost of delivering each lookup.
Buyers evaluating the listed business (second). The buyer section separates public listing facts from evidence still required for a purchase.
Key findings
Product
Product overview
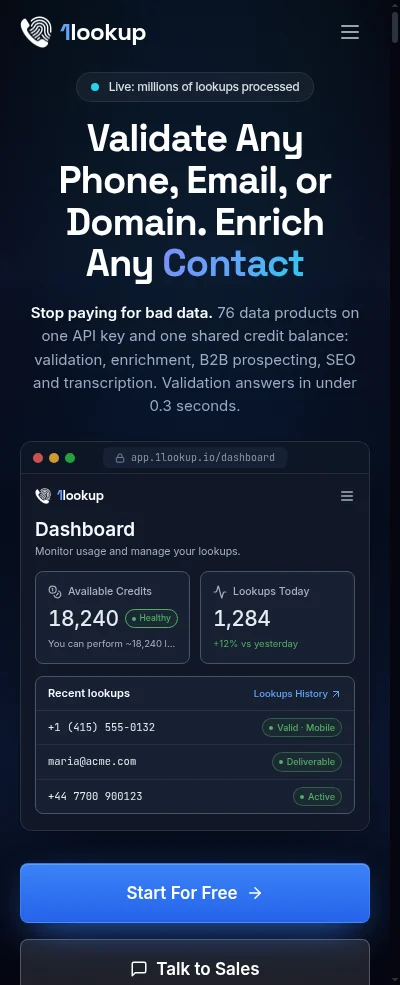
1Lookup is a US data-verification API founded in January 2022. Its monthly credit bundles cover phone, email and IP checks; the company also advertises company and social data, CRM integrations, REST access and an MCP server.[1][2][3]Fact
The homepage claims “76 data products on one API key” and “millions of lookups processed.” Those are company statements, separate from the connected Stripe revenue record, which begins in December 2025 in the public monthly series.[1][2]Founder
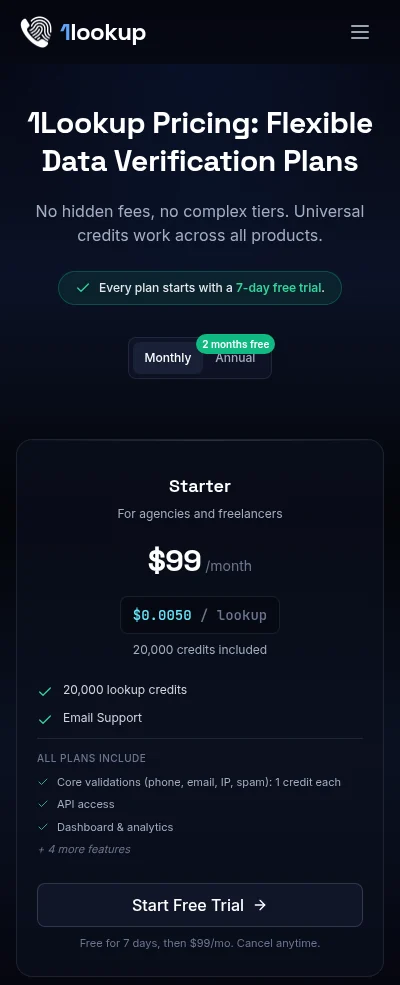
1Lookup · product and pricing pages · Nov 19, 2026
What to look for
- 1The homepage offers phone, email and domain validation, with free-trial and sales options.[2]Fact
- 2“76 data products” and “millions of lookups” are company claims, not independently verified usage counts.[2]Founder
- 3CRM and MCP access are advertised integration surfaces; customer adoption is not disclosed.[2]Fact
What to look for
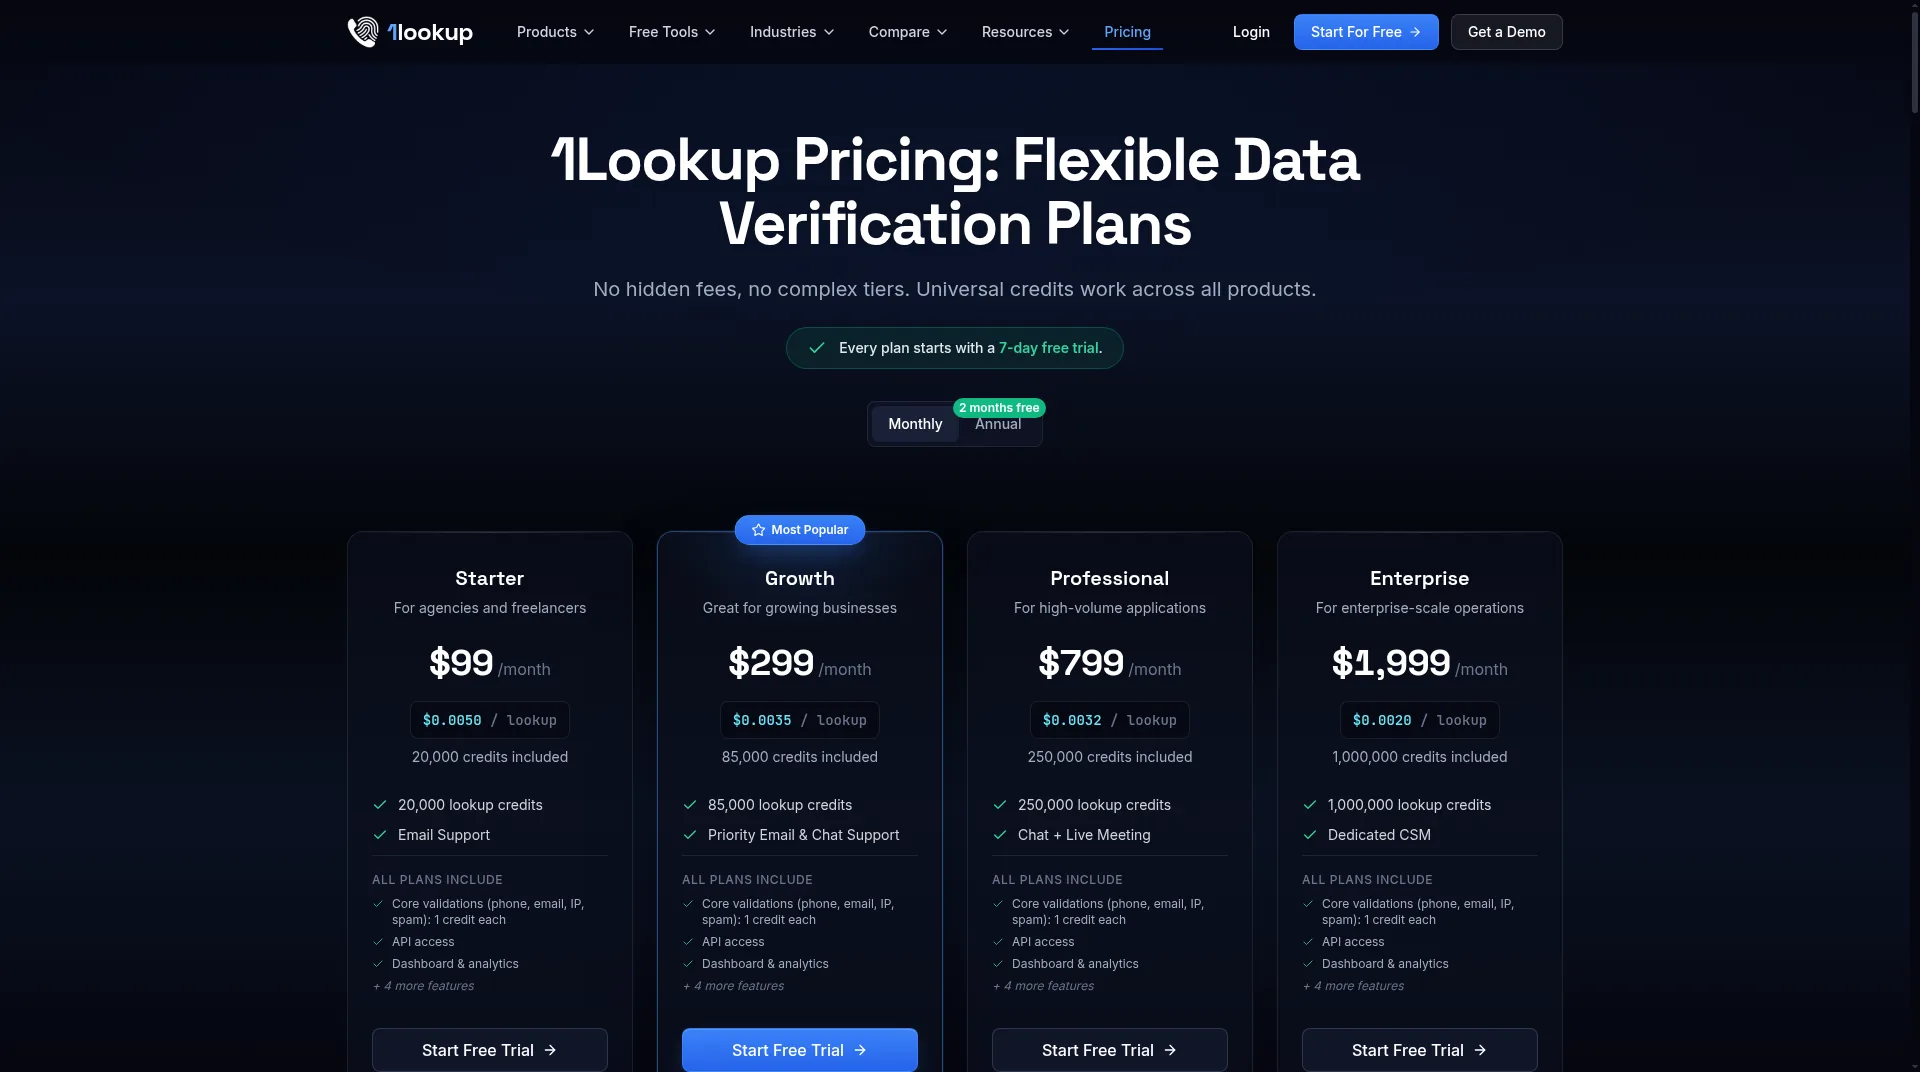
- 1Monthly plans run from Starter at $99 to Enterprise at $1,999; Growth is marked “Most Popular.”[3]Fact
- 2The cards show credit allotments and displayed per-lookup rates, allowing customers to compare the advertised volume discounts.[3]Fact
- 3The site advertises a seven-day trial and two months free with annual billing.[3]Fact
How it is built
A catalogue and a metering layer on top of other companies’ data. The engineering is a wrapper; the business is supply.[2][3]Our read
| Layer | What runs it | Evidence |
|---|---|---|
| Access | REST API, an MCP server and CRM integrations | Documented |
| Catalogue | 76 data products behind one API key | Company claim |
| Metering | One shared credit balance; core checks cost 1 credit each | Documented |
| Data supply | Upstream providers, resold per lookup; contracts and resale rights not public | Inferred |
| Billing | Stripe — receipts are verified through it | Documented |
1Lookup · implementation stack as far as the public record shows · Nov 19, 2026
A solo builder can reproduce the visible product in weeks: endpoints, a credit ledger, a billing hookup.Our read What cannot be reproduced from the outside is the supply side — the contracts, data quality and per-endpoint costs that decide whether each credit sold is profitable. In this category the replication risk sits in procurement, not code.Our read
Pricing: credit plans from $99 to $1,999 a month
Monthly credit plans range from $99 to $1,999. Core phone, email, IP and spam checks are described as one credit each; other lookup products may cost more credits.[3]Fact
| Plan | List price (monthly) | Credits included | Displayed price / lookup |
|---|---|---|---|
| Starter | $99 | 20,000 | $0.0050 |
| Growth (marked “Most Popular” on the page) | $299 | 85,000 | $0.0035 |
| Professional | $799 | 250,000 | $0.0032 |
| Enterprise | $1,999 | 1,000,000 | $0.0020 |
1Lookup · advertised USD prices · Nov 19, 2026
The site offers a seven-day trial and advertises two months free on annual billing. Its FAQ describes $5 of trial credits on Starter and $20 on Growth and above, with no day-one charge. The advertised annual discount is not a confirmed checkout total.[3]Fact
Revenue
Revenue analysis
The period table reports $547,960 over the last 30 days and current MRR of $255,025. MRR fell 4.2% over 30 days while receipts rose 23.6%.[1]Fact The two measures are moving in different directions; a billing breakdown is needed before attributing that divergence to usage expansion.Our read
Payment-verified monthly revenue (Dec 2025 – Nov 2026). November is partial: Nov 1–18 only.
The last-30-day period-table total is used throughout; the profile header shows $548,050. Last-12-month revenue is $4,295,891 out of $6,004,616 recorded all-time (71.5%). November is incomplete and excluded from the monthly chart.[1]Fact
Receipts and current MRR have different definitions; the ratio is descriptive, not a retention metric.
Daily receipts
Payment-verified daily revenue · Oct 21–Nov 18, 2026 (UTC) · incomplete final day excluded
All 29 complete UTC days from October 21 through November 18 have receipts. The last seven days total $127,499.[1]Fact Continuous receipts show an active payment stream, not customer retention, diversified demand or a subscription-quality guarantee.Our read
To distinguish repeat usage from temporary workloads, the next useful evidence is revenue by customer cohort, credit purchases versus consumption, and the largest customers’ share. A higher receipt total on its own would not answer those questions.Our read
Timeline
- Jan 2022Founded date on the TrustMRR profile (Jan 19, 2022).[1]Fact
- Dec 2025First complete month on the public TrustMRR series: $187,087.[1]Fact
- Mar 20262026Listed for sale on TrustMRR at $10,000,000 (Mar 16).[1]Fact
- Jul 2026Complete-month revenue $495,823, then a softer August–September.[1]Fact
- Oct 2026Best complete month on this record: $507,551.[1]Fact
- Nov 19, 2026Payment-verified last-30-day revenue $547,960; current MRR $255,025.[1]Fact
Customers
Acquisition evidence
No marketing channel is named on the TrustMRR profile. That is a disclosure gap, not evidence that acquisition is concentrated.[1]Fact
Implications for builders
Can 1Lookup repeat its recent usage revenue without sacrificing data-delivery economics?
Design the expansion path around a measurable unit
The shared credit balance lets customers use several lookup types without buying separate plans.[2][3]Fact For an API builder, this is a packaging option, not evidence of better conversion. On the current advertised price ladder, the Enterprise volume tier’s displayed unit rate is $0.0020, 60% lower than the Starter tier’s $0.0050.[3]Derived That is a difference between volume tiers, not a recorded decline in prices over time. Before adopting it, define credit consumption by endpoint and compare the effective price of each plan with delivery cost; a single balance can hide expensive endpoints if every credit is treated as equally cheap.Our read
Evaluate reliability alongside catalog breadth
CRM and MCP access are advertised product surfaces, not demonstrated switching costs.[2]Fact A smaller API can compete on a narrower workflow if data quality, latency and supplier continuity are strong. This report has no endpoint-level accuracy or reliability tests, so it cannot rank 1Lookup on those dimensions.Our read
Traffic & channels
Similarweb figures are third-party estimates for August–October 2026, Global, All Traffic, including subdomains. Its three-month total is 138,436, monthly average 46,145, and October 64,578. The displayed +33.04% change is labelled versus the previous month, not versus the entire three-month window.[11]Fact The monthly points sum to 138,435, one below the displayed total; this does not change the interpretation.
Similarweb, Aug–Oct 2026, Global, All Traffic. A three-month total.[11]Fact
Similarweb monthly-chart point for Oct 2026, same scope. Not the three-month total.[11]Fact
Similarweb’s displayed monthly visits figure for the same Aug–Oct window, not October alone.[11]Fact
The percentage printed under the three-month total; labelled vs previous month,
| Month | Estimated visits |
|---|---|
| August 2026 | 25,316 |
| September 2026 | 48,541 |
| October 2026 | 64,578 |
Similarweb estimated visits · Aug–Oct 2026 · Global, All Traffic, including subdomains
Engagement, also for Aug–Oct 2026, Global, All Traffic: monthly unique visitors 24,992, deduplicated audience 22,118, visit duration 00:00:28, pages/visit 1.61, bounce rate 42.20%.[11]Fact Device split in the same window: Desktop 30.30%; Mobile Web 69.70%.[11]Fact
Top country or region shares in that global window: India 23.94%; United States 22.63%; Pakistan 8.16%; Türkiye 5.81%; Italy 4.92%. [11]Fact Channel mix, same window: Direct 31.66%; Organic Search 27.58%; Paid Search 1.48%; Referrals 31.35%; Display Ads 0.43%; Organic Social 3.23%; Paid Social 0.10%; Generative AI 3.06%; Email 0.82%; Affiliates 0.29%.[11]Fact Displayed ranks in the same view: Global #591,260; United States #465,680.[11]Fact
Direct (31.66%) and Referrals (31.35%) are the largest estimated channel shares. For a builder, this is a reason to investigate the sources of repeat and referred demand, not proof of a partner-led growth engine. Neither labels the converting customers or supplies acquisition cost.[11]Our read
Search visibility
Semrush’s domain overview estimates 5.2K organic search traffic for 1lookup.io on a Worldwide, Desktop snapshot dated 2026-11-18.[10]Fact That is an SEO estimate of organic search, not total visits, not All Traffic, and not the August–October window above.
Semrush, Worldwide, Desktop, snapshot 2026-11-18. Organic search only, not total visits.[10]Fact
Semrush; the card labels this “average.” 607 referring domains, 14K backlinks.[10]Fact
Semrush paid-search traffic 0; paid keywords 0. This is only Semrush’s paid-search estimate — it does not prove there are no ads on other channels, and it is not Similarweb’s paid-search share of visits.[10]Fact
Semrush is a Worldwide, Desktop search snapshot dated November 18; Similarweb covers an earlier multi-month All Traffic period. The tools cannot be combined into a conversion rate or a revenue-per-visit metric. Neither establishes channel profitability or paid spend. Unclear comparison percentages are excluded.
For buyers
For buyers: price and transfer conditions
At the $10,000,000 asking price, the listing is 1.52× last-30-day revenue annualised, versus 3.27× current MRR annualised.[1]Derived Neither is a profit multiple. The difference makes billing mix and repeat usage central to valuation, rather than making either denominator automatically correct.Our read
Ask ÷ (last-30-day revenue × 12), as TrustMRR shows it (1.5x). Our calculation to two decimals is 1.52×.[1]Derived
Nov 1–18, 2026, 18 complete UTC days; $17,438/day, or about $523,127 over 30 days at that pace.[1]Derived
Public asking prices, not completed transactions. Business models, costs and transfer conditions differ; this table is marketplace context, not a valuation benchmark.
| Listing · Nov 19, 2026 | What it is | Best complete month | Latest complete month | Ask (TrustMRR multiple) |
|---|---|---|---|---|
| Get Funneled[5] | AI funnel service | $20,146 (Oct 2026) | $20,146 (Oct 26), at its best | $250,000 (1.0x) |
| Boothie[8] | AI photo app | $56,432 (Oct 2026) | $56,432 (Oct 26), at its best | $900,000 (1.4x) |
| Laper[6] | AI screenwriting tool | $53,464 (Oct 2026) | $53,464 (Oct 26), at its best | $1,470,500 (2.3x) |
| White Glove Content[7] | Faceless-video studio | $68,372 (Oct 2026) | $68,372 (Oct 26), at its best | $2,500,000 (3.6x) |
| Plutio[9] | Client-work OS | $20,593 (Feb 2026) | $17,364 (Oct 26), -16% from best | $1,300,000 (6.2x) |
Request customer-level purchases and consumption, concentration and refund data, supplier contracts and transfer rights, endpoint delivery costs, and operational dependence on the seller. The profile’s 40% margin is seller-reported, not independently audited. Payment verification does not establish ownership of the data or rights to resell it.[1]Our read
ODDIG has no relationship with the seller and receives no sale proceeds. This is research, not investment advice.
What it costs to run
One cost dominates: the data itself. 1Lookup resells lookups it must buy upstream, and at the carrier-data end, published list prices for that data sit above its own retail price.Our read
| Single check | Published price |
|---|---|
| 1Lookup retail · 1 credit, core check, by plan | $0.0020–$0.0050 |
| Twilio · Line Type Intelligence (list) | $0.008 |
| Twilio · Line Status (list, by volume) | $0.0039–$0.0070 |
| Twilio · Caller identification, US (list) | $0.01 |
| Twilio · Basic formatting and validation | Free |
1Lookup · retail credit price vs a flagship supplier’s list prices · Nov 19, 2026
At list prices the arithmetic does not close: one carrier lookup bought from Twilio ($0.008) costs more than 1Lookup charges for it on every plan ($0.0020–$0.0050).[12]Derived The business therefore runs on cheaper supply — volume HLR and data aggregators list carrier checks nearer $0.001–$0.004 — or on negotiated contracts the public record does not show.Our read The seller’s 40% margin field implies total costs of about $304,531 in October; which endpoint mix and supplier terms produce that figure is the central diligence question in this listing.[1]Derived What cannot be bounded from public data: the contracted rates actually paid, the share of expensive endpoints (a US caller name costs 10 credits), and support load per customer.Our read
What the ask assumes
On the receipts denominator the ask looks cheap: 1.52× sits below the comparison set’s median multiple of about 2.3×, and only Get Funneled (1.0×) is lower.[1]Derived But 1Lookup’s receipts run at 2.15× its MRR, so the choice of denominator moves the multiple more than the negotiation likely will. The same ask, five ways:
| Denominator | Annualised | Ask multiple |
|---|---|---|
| Peak month · Oct 2026 ($507,551) | $6,090,612 | 1.64× |
| November pace · Nov 1–18 ($313,876) | $6,277,520 | 1.59× |
| Last 30 days ($547,960) | $6,575,520 | 1.52× |
| Last 12 months, actual | $4,295,891 | 2.33× |
| Current MRR ($255,025) | $3,060,300 | 3.27× |
1Lookup · the $10,000,000 ask against five denominators · Nov 19, 2026
Our read: the $10,000,000 ask prices usage revenue as if it were subscription revenue. On the recurring base a buyer can underwrite today — current MRR — the multiple is 3.27×, above the set’s median. At the seller’s own 40% margin field, October’s profit was about $203,020, which makes the ask roughly 49 months of October-level profit — and October was a record month in a flat half-year: August–October receipts were 0.6% below May–July.[1]Derived A buyer is paying today for repeat usage that the public record has not yet separated from prepayments.Our read
Takeaways
The attractive feature is expansion through a shared credit balance. The investment case remains conditional on repeat usage and transferable data-delivery economics, neither of which a payment feed establishes.
Why we scored it this way
For builders
- For a multi-endpoint API, make credit consumption and plan-level unit prices explicit before asking customers to expand usage.
- Evaluate whether customers repeatedly consume the data, not just whether they buy credits.
Do not infer
- Do not use the cash–MRR gap as proof of expansion, retention or recurring revenue.
- Do not treat an integration list or a long payment series as demonstrated lock-in.
Predictions
Our predictions
Three claims with dates. We mark each one right or wrong on its date and keep the result on the page.
Track record: the predictions in our earlier reports are still open; the first checks land Dec 1, 2026. We mark each prediction right or wrong on its date and keep the result on the page.
What could prove us wrong
These are conditions to revisit, not forecasts.
- Repeat usage. Compare subsequent complete months with October and examine whether repeat customers, rather than fresh prepayments or a few workloads, account for the receipts. Public totals alone cannot resolve that distinction.Check: complete-month revenue and any repeat-customer disclosure into Mar 2027.
- Delivery economics. Reassess the case if supplier terms, endpoint costs or usage mix change. A growing credit balance is only attractive if the associated delivery remains viable.Check: plan prices, supplier terms and endpoint mix on the site and profile into Mar 2027.
Appendix
Frequently asked
Does the cash–MRR gap prove usage expansion?
No. Usage pricing makes that explanation plausible, but customer purchases, consumption and billing composition are not disclosed.[1][3]
What does the 1.5× listing multiple mean?
The $10,000,000 ask divided by ($547,960 × 12) is 1.52×. This is a recent-revenue multiple, not a profit or retention measure.[1]
Do 719 subscriptions establish average customer revenue?
No. The public count has no customer or plan breakdown; credit consumption and subscription states need separate definitions.[1]
Sources
- [1]TrustMRR: 1Lookup — profile, verified revenue periods, daily and monthly series, current MRR, listing (ask $10,000,000, 1.5×, listed 2026-03-16, 80 offers, 80,474 viewers), 719 active subscriptions, 40% last-30-day profit margin field, domain rating 42, additional-info claims. Revenue connected through Stripe. Synced 2026-11-19 12:08 AM PT; read 2026-11-19 (America/Los_Angeles).
- [2]1Lookup homepage — product description, integrations, MCP access, trial terms and company usage claims. Nov 19, 2026.
- [3]1Lookup pricing — monthly plans: Starter $99 / 20,000 credits; Growth $299 / 85,000; Professional $799 / 250,000; Enterprise $1,999 / 1,000,000. Displayed per-lookup rates: $0.0050, $0.0035, $0.0032 and $0.0020. Seven-day trial and advertised annual discount. Nov 19, 2026.
- [4]Wayback: 1Lookup pricing — archived pricing-page history. Historical list prices could not be established reliably; no price-change conclusion is drawn. Nov 19, 2026.
- [5]TrustMRR: Get Funneled — for-sale comparable: ask $250,000, TrustMRR multiple 1.0×, last 30 days $20,028, October $20,146. Revenue connected through Stripe. Synced 2026-11-18 8:02 PM PT; read 2026-11-19 (America/Los_Angeles).
- [6]TrustMRR: Laper — for-sale comparable: ask $1,470,500, TrustMRR multiple 2.3×, last 30 days $52,152, October $53,464. Revenue connected through Stripe. Synced 2026-11-19 12:36 AM PT; read 2026-11-19 (America/Los_Angeles).
- [7]TrustMRR: White Glove Content — for-sale comparable: ask $2,500,000, TrustMRR multiple 3.6×, last 30 days $57,971, October $68,372. Revenue connected through Stripe. Synced 2026-11-18 9:45 PM PT; read 2026-11-19 (America/Los_Angeles).
- [8]TrustMRR: Boothie — for-sale comparable: ask $900,000, TrustMRR multiple 1.4×, last 30 days $54,692, October $56,432. Revenue connected through RevenueCat. Synced 2026-11-18 9:52 PM PT; read 2026-11-19 (America/Los_Angeles).
- [9]TrustMRR: Plutio — for-sale comparable: ask $1,300,000, TrustMRR multiple 6.2×, last 30 days $17,502, October $17,364. Revenue connected through Stripe. Synced 2026-11-19 12:13 AM PT; read 2026-11-19 (America/Los_Angeles).
- [10]Semrush: 1lookup.io — third-party search estimates and domain metrics; Worldwide, Desktop; snapshot Nov 18, 2026. Search traffic is not total visits or verified customer acquisition. Nov 19, 2026.
- [11]Similarweb: 1lookup.io — third-party visit, device, geography and channel estimates; Aug–Oct 2026, Global, All Traffic, subdomains included. The displayed change is versus the previous month, not the three-month window. Nov 19, 2026.
- [12]Twilio Lookup pricing — published per-request list prices read Nov 19, 2026: basic formatting and validation free; Line Type Intelligence $0.008 per request; Line Status $0.007 down to $0.00385 by volume; inbound caller identification $0.01 (US); Identity Match $0.10. Negotiated and volume rates differ.
Product images © 1Lookup. Figures and public offers are dated Nov 19, 2026 and may change.


Comments are closed for this article.